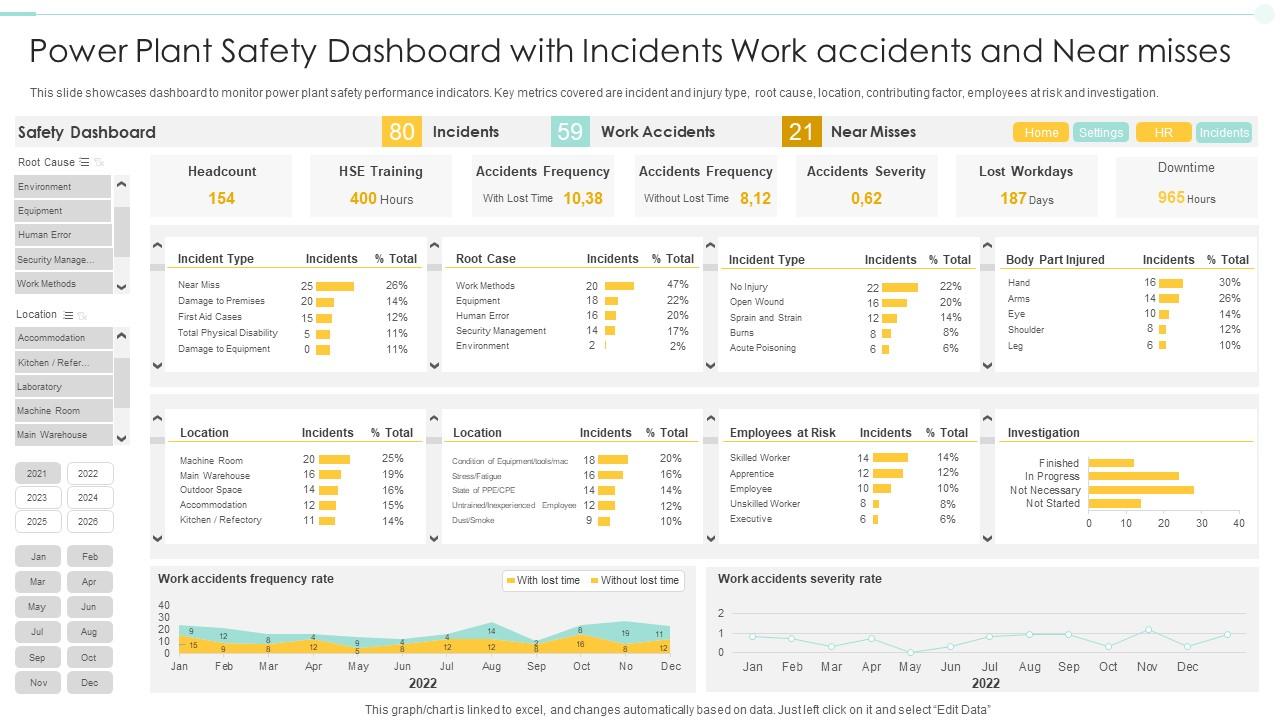
Near Misses And Accidents: A Visual Analysis Of Airplane Safety Data

Table of Contents
Visualizing Near-Miss Data: Identifying High-Risk Scenarios
Near-miss reporting is a cornerstone of aviation safety. Data from pilot reports, Air Traffic Control (ATC) communications, and flight data recorders (FDRs) provide invaluable information about potentially hazardous situations that, thankfully, did not result in accidents. Visualizing this data allows for the identification of high-risk scenarios and trends. Effective visualization techniques, such as heatmaps showing geographical hotspots for near misses, and scatter plots illustrating correlations between near-miss frequency and specific flight phases, provide a clearer picture than raw data alone.
- Effective Visual Representations: Heatmaps effectively pinpoint geographical areas with a higher concentration of near misses, highlighting potential environmental or infrastructure-related risks. Scatter plots can reveal relationships between variables like aircraft type and the phase of flight (e.g., approach, takeoff, climb) during which near misses are most frequent.
- Limitations of Reported Near Misses: It's crucial to acknowledge that near-miss reporting relies on accurate and consistent reporting by pilots and ATC. Underreporting remains a challenge, meaning visual analyses may not capture the full picture.
- Technology's Role: The advent of Automatic Dependent Surveillance-Broadcast (ADS-B) data, providing real-time aircraft position and trajectory information, drastically improves near-miss detection, enabling more comprehensive and accurate visual analysis.
Analyzing Accident Data: Uncovering Patterns and Root Causes
Aviation accidents, while statistically rare, are meticulously investigated to understand their root causes and prevent future occurrences. Visual analysis plays a critical role in this process. Timelines depicting the sequence of events leading up to an accident can reveal crucial details often missed in textual reports. Network diagrams effectively illustrate the complex interplay of causal factors, showing how human error, mechanical failure, and environmental conditions might interact to contribute to an accident.
- Common Causes of Aviation Accidents: Visualizations can effectively demonstrate the relative frequency of different contributing factors. For example, a bar chart could clearly show the proportion of accidents attributable to pilot error, mechanical failure, weather conditions, or air traffic control issues.
- Highlighting Frequency of Accident Causes: By visualizing the frequency of different accident causes over time, we can identify trends and potential areas for targeted safety improvements. This data-driven approach ensures that safety interventions are focused on the most critical areas.
- Role in Accident Investigation and Safety Improvements: Visual analysis is not just a tool for post-accident investigation; it actively informs the development of new safety regulations, improved training procedures, and advancements in aircraft technology, leading to safer skies.
The Role of Technology in Enhancing Airplane Safety Data Analysis
The sheer volume of data generated by modern aviation necessitates sophisticated technology for effective analysis. Big data analytics, machine learning, and artificial intelligence (AI) are transforming how we collect, analyze, and visualize airplane safety data.
- Technologies Used in Flight Data Analysis: Data mining tools sift through massive datasets to identify patterns and anomalies. Specialized visualization software provides interactive dashboards and intuitive representations of complex information.
- Predictive Modeling for Safety Hazards: Machine learning algorithms can analyze historical data to identify potential safety hazards and predict the likelihood of future accidents, enabling proactive safety interventions.
- AI's Potential in Automating Safety Analysis: AI has the potential to automate aspects of safety analysis, freeing up human experts to focus on more complex tasks and accelerating the identification of critical safety issues.
Conclusion
Visual analysis of near misses and aviation accidents provides an invaluable tool for understanding and improving airplane safety. By leveraging sophisticated data visualization techniques and advanced technologies like AI and machine learning, we can identify critical trends, uncover root causes of accidents, and develop more effective safety protocols. The ongoing integration of technology further enhances our ability to analyze vast datasets, leading to more accurate predictions and proactive risk mitigation. Stay informed about advancements in airplane safety by following the resources of organizations like the FAA and IATA. Understanding and analyzing near-miss and accident data is crucial for continuous improvement in aviation safety, ensuring safer skies for all.

Featured Posts
-
 Market Volatility Us Fiscal Issues Fuel Stock Market Drop
May 23, 2025
 -
 The Hunger Games Prequel Kieran Culkin Confirmed As Caesar Flickerman
May 23, 2025
 -
 Thames Waters Executive Pay Outrage Over Bonuses Amidst Crisis
May 23, 2025
 -
 Freddie Flintoffs Post Crash Recovery Face Fully Healed
May 23, 2025
 -
 Grand Ole Opry Goes Global Historic London Show At Royal Albert Hall
May 23, 2025
Latest Posts
-
 Unexpected Joe Jonas Concert Thrills Fort Worth Stockyards Crowd
May 23, 2025
 -
 Fort Worth Stockyards An Unforgettable Night With Joe Jonas
May 23, 2025
 -
 Dc Legends Of Tomorrow Frequently Asked Questions And Answers
May 23, 2025
 -
 The Last Rodeo Exploring Neal Mc Donoughs Character
May 23, 2025
 -
 A Deep Dive Into Dc Legends Of Tomorrow
May 23, 2025
