Apple Stock (AAPL) Price Targets: Key Levels And Technical Analysis

Table of Contents
Current Market Conditions and AAPL's Performance
The current market sentiment is relatively cautious, exhibiting a degree of sideways movement. While inflation concerns persist, recent economic data suggests a possible slowdown in interest rate hikes. This macro environment impacts Apple, but its robust ecosystem and loyal customer base provide some resilience.
Apple's recent financial reports reveal continued strong performance, although revenue growth has shown some moderation compared to previous years. The latest earnings report showed impressive growth in services revenue, demonstrating the strength of Apple's ecosystem and recurring revenue streams. A comparison to the previous quarter and year reveals a pattern of solid but not explosive growth.
- Impact of macroeconomic factors on AAPL: Concerns about a potential recession could impact consumer spending on discretionary items like iPhones and other Apple products. However, Apple’s premium pricing and strong brand loyalty provide some insulation.
- Analysis of recent product launches and their market reception: The launch of the iPhone 15 series has generally been well-received, though initial sales figures will be crucial in evaluating its true market impact on AAPL stock price.
- Comparison to competitor performance (e.g., MSFT, GOOG): While Microsoft (MSFT) and Google (GOOG) also face macroeconomic headwinds, their diverse business models offer some differentiation. Comparing AAPL’s performance against these tech giants provides valuable context for assessing its stock price trajectory.
Key Price Levels and Support/Resistance
Identifying key price levels is crucial for predicting future AAPL price movements. Historical data reveals significant support and resistance points. Support levels represent prices where buying pressure is expected to outweigh selling pressure, potentially preventing further price declines. Resistance levels are the opposite – prices where selling pressure is expected to be strong, potentially halting upward momentum.
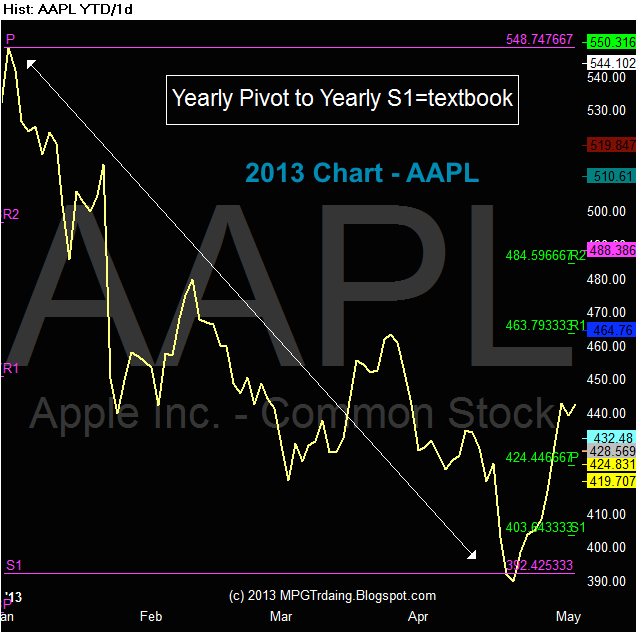
Visual representations, such as charts with clearly marked support and resistance lines, are essential tools. These charts highlight the historical significance of these levels and their potential influence on future price action.
- Identification of major support levels (e.g., $150, $140): These levels have historically provided significant buying support. A break below these levels could signal further downward pressure.
- Identification of major resistance levels (e.g., $180, $200): These levels have previously capped AAPL's upward momentum. A decisive break above these levels could indicate a stronger bullish trend.
- Explanation of how these levels are determined (technical analysis): Support and resistance levels are identified using various technical analysis tools, including chart patterns, trendlines, and pivot points.
Technical Indicators for AAPL Stock
Technical indicators provide valuable insights into AAPL's price trends and momentum. Moving averages, Relative Strength Index (RSI), and Moving Average Convergence Divergence (MACD) are among the most widely used tools.
Moving averages smooth out price fluctuations, helping to identify trends. The RSI gauges the momentum of price changes, highlighting overbought and oversold conditions. The MACD identifies trend changes by comparing two moving averages.
- Analysis of moving averages (e.g., 50-day, 200-day): A bullish crossover (50-day moving average crossing above the 200-day moving average) is often considered a positive signal. The opposite is a bearish signal.
- Interpretation of RSI (Relative Strength Index) to gauge momentum: An RSI above 70 suggests the stock may be overbought, while an RSI below 30 suggests it may be oversold.
- Use of MACD (Moving Average Convergence Divergence) to identify trends: A bullish divergence (price makes a lower low, while the MACD makes a higher low) can be a sign of a potential trend reversal.
Sentiment Analysis and News Impact
Investor sentiment and news events significantly influence AAPL's price. Positive news, such as strong product launches or positive earnings reports, tends to boost the stock price. Conversely, negative news, like supply chain disruptions or regulatory challenges, can negatively impact the price. Social media sentiment and analyst ratings also play a role.
- Impact of positive and negative news on AAPL stock price: A new product launch, exceeding earnings expectations, or positive analyst upgrades typically have a positive effect. Negative news will do the opposite.
- Influence of social media sentiment and analyst ratings: Strong positive sentiment across various social media platforms tends to have a positive correlation with price. Analyst ratings, while not always accurate, can provide some insight.
- Discussion of potential risks and opportunities: Potential risks include competition, macroeconomic uncertainty, and supply chain disruptions. Opportunities include growth in new markets, technological innovation, and further expansion of services.
Conclusion
Understanding Apple Stock (AAPL) price targets requires a comprehensive approach combining analysis of current market conditions, key price levels, technical indicators, and investor sentiment. By understanding the interplay of these factors, investors can develop a more informed strategy. Remember, while technical and fundamental analysis provides valuable insight, they are not foolproof predictors.
While this analysis provides valuable insight into potential AAPL price targets, remember to conduct your own thorough research before making any investment decisions. Stay informed on Apple stock (AAPL) price movements and continue to monitor key levels and technical indicators to refine your investment strategy around Apple stock. Learn more about effective Apple Stock (AAPL) price target analysis and invest wisely!

Featured Posts
-
 Kharkovschina 89 Svadeb V Odin Den Populyarnost Krasivykh Dat
May 24, 2025
 -
 Could Kyle Walker Peters Join Crystal Palace On A Free
May 24, 2025
 -
 West Ham Submits Bid For Kyle Walker Peters
May 24, 2025
 -
 Porsche 356 Dari Zuffenhausen Ke Legenda Otomotif Jerman
May 24, 2025
 -
 Maryland Softballs Aubrey Wurst Dominates In 11 1 Rout Of Delaware
May 24, 2025
Latest Posts
-
 Navigating High Stock Market Valuations Advice From Bof A
May 24, 2025
 -
 Bof A On Stock Market Valuations A Reasoned Perspective For Investors
May 24, 2025
 -
 Thames Water Executive Bonuses A Look At The Figures And Public Reaction
May 24, 2025
 -
 Are Thames Water Executive Bonuses Fair A Critical Analysis
May 24, 2025
 -
 Bof As View Why Current Stock Market Valuations Shouldnt Scare Investors
May 24, 2025
