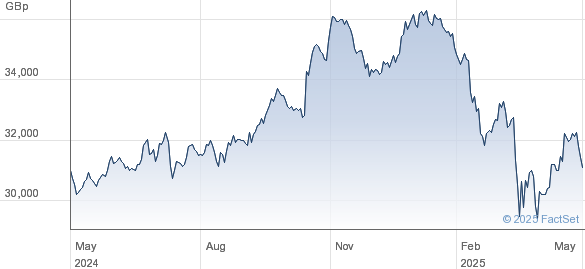
Amundi Dow Jones Industrial Average UCITS ETF Dist: Understanding Net Asset Value (NAV)

Table of Contents
What is Net Asset Value (NAV) and How is it Calculated for the Amundi Dow Jones Industrial Average UCITS ETF Dist?
Net Asset Value (NAV) represents the net value of an ETF's underlying assets per share. For the Amundi Dow Jones Industrial Average UCITS ETF Dist, this means the total value of the 30 constituent companies of the Dow Jones Industrial Average, held within the ETF, minus any liabilities. Understanding the daily NAV is fundamental for assessing the ETF's performance and your investment's growth.
The calculation process involves several key components:
- Value of Underlying Assets: This is the primary driver of NAV. The ETF holds a portfolio mirroring the Dow Jones Industrial Average; therefore, fluctuations in the prices of these 30 companies directly impact the NAV.
- Dividends and Distributions: Dividends received from the underlying companies are added to the NAV, impacting the value per share. The Amundi Dow Jones Industrial Average UCITS ETF Dist is a distributing ETF, meaning dividends are usually paid out to shareholders.
- Expenses and Management Fees: The ETF incurs expenses for management, administration, and other operational costs. These expenses reduce the overall NAV.
Simple NAV Calculation Example:
Let's imagine the total value of the underlying assets is €100 million, and the ETF has 10 million shares outstanding. If the total expenses are €1 million, the NAV would be calculated as follows: (€100 million - €1 million) / 10 million shares = €9.90 per share.
- Key Factors Affecting Daily NAV Calculation:
- Price changes of the Dow Jones Industrial Average components.
- Dividend payments from constituent companies.
- Accrual of management fees and expenses.
- Currency fluctuations (if applicable, depending on the ETF's holdings).
You can find the daily NAV of the Amundi Dow Jones Industrial Average UCITS ETF Dist on the Amundi website, major financial news platforms, and your brokerage account.
Factors Influencing the NAV of the Amundi Dow Jones Industrial Average UCITS ETF Dist
Several factors influence the NAV of the Amundi Dow Jones Industrial Average UCITS ETF Dist on a daily basis:
- Market Fluctuations: The most significant influence is the overall performance of the Dow Jones Industrial Average. Market volatility, whether driven by economic news, geopolitical events, or investor sentiment, directly impacts the prices of the underlying stocks and, consequently, the NAV.
- Currency Exchange Rates: While the ETF tracks a US dollar-denominated index, currency exchange rate fluctuations between the euro (or your local currency) and the US dollar can affect the NAV if you're investing in a different currency.
- Dividend Payouts: Dividend payments from the underlying companies increase the overall value of the ETF's assets, positively impacting the NAV. However, remember that distributing ETFs pay out dividends, therefore slightly reducing the NAV post-distribution.
- Management Fees and Expense Ratios: The expense ratio, a percentage of the ETF's assets, is deducted regularly and impacts the NAV, albeit usually slightly.
NAV vs. Market Price: Understanding the Difference for the Amundi Dow Jones Industrial Average UCITS ETF Dist
While NAV represents the intrinsic value of the ETF's holdings, the market price reflects the price at which the ETF shares are currently trading. These values are not always identical.
- Discrepancies between NAV and Market Price: Differences often arise due to supply and demand dynamics. High demand can push the market price above the NAV (a premium), while low demand might result in the market price falling below the NAV (a discount). The bid-ask spread, the difference between the highest buy and lowest sell orders, also contributes to these discrepancies.
- Premium/Discount Implications: A significant and persistent premium or discount might indicate market inefficiencies or investor sentiment outweighing the underlying asset value.
Using NAV Information to Make Informed Investment Decisions with the Amundi Dow Jones Industrial Average UCITS ETF Dist
Monitoring NAV changes is critical for effective investment management.
- Tracking Investment Performance: By comparing the current NAV to your purchase price, you can readily assess the growth (or loss) of your investment.
- Performance Analysis: Comparing the NAV over time allows you to analyze the ETF's long-term performance against its benchmark (the Dow Jones Industrial Average).
- Buy/Sell Signals: While not a sole indicator, significant changes in NAV can inform your investment strategy. Consistent increases could indicate a strong trend, potentially suggesting a hold or buy, while prolonged declines might trigger a review of your investment.
Using NAV information alongside other market indicators allows for more comprehensive investment analysis and improves decision-making.
Conclusion: Mastering Net Asset Value for the Amundi Dow Jones Industrial Average UCITS ETF Dist
Understanding the Net Asset Value (NAV) of the Amundi Dow Jones Industrial Average UCITS ETF Dist is fundamental for successful ETF investing. Regularly monitoring NAV changes, understanding the factors influencing it, and comparing it to the market price allows for informed investment decisions. By mastering these concepts, you can enhance your portfolio management and achieve your investment goals. Continue your research into the Amundi Dow Jones Industrial Average UCITS ETF Dist NAV and consult with a financial advisor to tailor your investment strategy to your risk tolerance and financial objectives. Remember, informed ETF investing starts with a clear understanding of NAV.

Featured Posts
-
 Collaboration And Growth Take Center Stage At Best Of Bangladesh In Europe 2nd Edition
May 24, 2025
 -
 Discover Joy Crookes New Song Carmen
May 24, 2025
 -
 Amundi Msci World Ex Us Ucits Etf Acc A Guide To Net Asset Value Nav
May 24, 2025
 -
 Tuukka Taponen F1 Debyytti Jo Taenae Vuonna Jymypaukku Uutiset
May 24, 2025
 -
 Effetto Dazi Sulle Importazioni Di Abbigliamento Negli Usa
May 24, 2025
Latest Posts
-
 Apple Stock And Tariffs Assessing The Risks To Buffetts Portfolio
May 24, 2025
 -
 Analysts 254 Apple Stock Prediction Time To Buy
May 24, 2025
 -
 Buffetts Apple Investment Navigating The Impact Of Trump Era Tariffs
May 24, 2025
 -
 Apple Stock 200 Entry Point Before 254 Target
May 24, 2025
 -
 Apple Vs Trump Tariffs Will Buffetts Top Tech Stock Crack
May 24, 2025
