How To Track The Net Asset Value (NAV) Of The Amundi Dow Jones Industrial Average UCITS ETF
 Of The Amundi Dow Jones Industrial Average UCITS ETF")
Table of Contents
Understanding the Amundi Dow Jones Industrial Average UCITS ETF
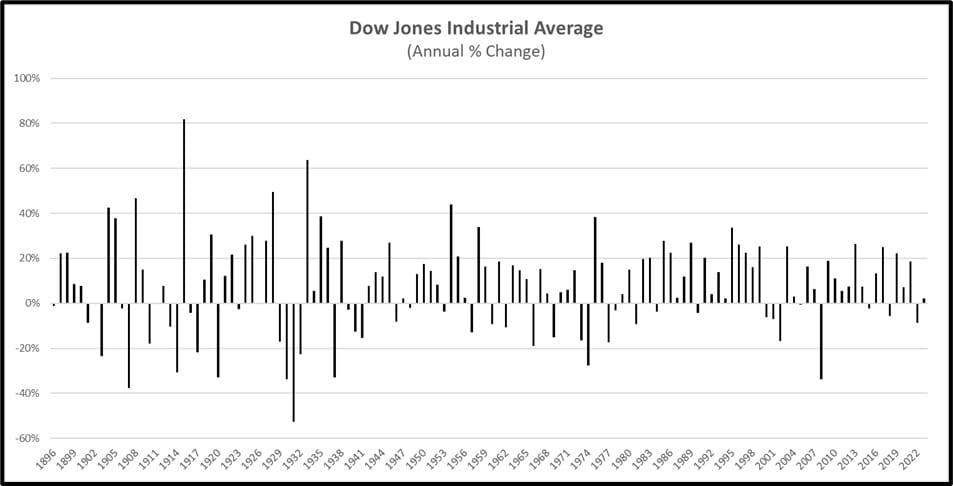
The Amundi Dow Jones Industrial Average UCITS ETF is designed to track the performance of the Dow Jones Industrial Average (DJIA), a well-known benchmark index of 30 large, publicly-owned companies in the United States. This ETF offers investors a convenient way to gain exposure to this iconic index without needing to invest directly in individual stocks. Its investment objective is to replicate the performance of the DJIA, providing a diversified investment in leading American companies. Understanding its NAV is essential because it directly reflects the value of the underlying assets held by the ETF. Regularly monitoring the NAV allows you to assess the ETF's growth, identify potential trends, and make informed decisions about your portfolio. While the precise ticker symbol will vary depending on your exchange, you can easily find it by searching online using "Amundi Dow Jones Industrial Average UCITS ETF ticker."
Official Sources for NAV Data
Accurately tracking the NAV of the Amundi Dow Jones Industrial Average UCITS ETF requires relying on dependable sources. Here are three primary channels to obtain this crucial information:
The Amundi Website
The most reliable source for NAV data is the official Amundi website. Amundi, as the ETF's issuer, provides up-to-date NAV information directly. Navigate to their website (the specific URL will depend on your region) and look for a section dedicated to ETF factsheets or fund information. You will usually find the latest NAV displayed prominently, often updated daily. Remember to check the time zone displayed to ensure accuracy based on your location. You may find the NAV presented in multiple currencies; ensure you select the currency that aligns with your portfolio records.
- Frequency of Updates: Typically daily, reflecting the closing price of the underlying assets.
- Data Presentation: Expect variations based on the currency and time zone.
Financial Data Providers
Several reputable financial data providers, such as Bloomberg, Refinitiv, and Yahoo Finance, offer detailed information on various ETFs, including the Amundi Dow Jones Industrial Average UCITS ETF. These platforms generally provide a search function; simply input the ETF's name or ticker symbol to locate its NAV. While offering comprehensive data, note that some of these services require subscriptions and may charge fees based on your usage level.
- Search Functionality: Search using the ETF's full name or ticker symbol.
- Subscription Fees: Be aware of potential costs associated with these platforms.
Brokerage Platforms
If you already hold this ETF within your brokerage account, the easiest way to track its NAV is usually via your brokerage platform itself. Most brokerage accounts display the current NAV alongside other relevant information for each asset within your portfolio. However, remember that the data presentation may differ slightly based on your specific brokerage.
- Convenience: Ideal for existing investors with an account already set up.
- Platform Variations: Data display may differ across brokerages.
Calculating NAV (Advanced)
While the previous methods provide ready access to the NAV, understanding the underlying calculation can be beneficial. The basic formula for calculating NAV is:
Assets – Liabilities = NAV
Assets represent the total value of the ETF's holdings in the Dow Jones Industrial Average components. Liabilities encompass the ETF's expenses, management fees, and other obligations. However, attempting to independently calculate the NAV for a complex ETF like this is impractical due to the need for precise and real-time data on all its underlying assets and liabilities. This is why relying on official sources is strongly recommended.
Interpreting NAV Changes and Making Investment Decisions
Regularly monitoring NAV changes is essential for assessing the ETF’s performance. Increases in NAV generally indicate positive growth aligned with the performance of the DJIA, while decreases reflect negative movements in the underlying index. Compare the NAV against the DJIA index itself to assess how well the ETF tracks its benchmark. Remember that the NAV alone should not be the sole factor in your investment decisions. You must also consider other crucial elements such as expense ratios, management fees, and your overall investment strategy.
Conclusion: Mastering NAV Tracking for the Amundi Dow Jones Industrial Average UCITS ETF
Tracking the Net Asset Value of your Amundi Dow Jones Industrial Average UCITS ETF is crucial for effective investment management. We’ve outlined three reliable methods: checking the official Amundi website, using financial data providers, or accessing your brokerage platform. Always prioritize official sources to guarantee accuracy. Regular monitoring of your ETF's NAV allows for informed decisions, contributing to a stronger investment strategy. Start tracking the Net Asset Value (NAV) of your Amundi Dow Jones Industrial Average UCITS ETF today using the methods outlined above! Regular monitoring of your ETF's NAV is a crucial step in effective investment management.
Featured Posts
-
 Pochti 40 Par Pozhenilis Na Kharkovschine Svadebniy Bum V Data Foto
May 24, 2025
Pochti 40 Par Pozhenilis Na Kharkovschine Svadebniy Bum V Data Foto
May 24, 2025 -
 Amundi Dow Jones Industrial Average Ucits Etf How To Interpret Its Net Asset Value
May 24, 2025
Amundi Dow Jones Industrial Average Ucits Etf How To Interpret Its Net Asset Value
May 24, 2025 -
 Serious M56 Crash Car Overturn Results In Casualty Treatment
May 24, 2025
Serious M56 Crash Car Overturn Results In Casualty Treatment
May 24, 2025 -
 Should You Follow Wedbushs Lead On Apple Stock Despite Price Target Cut
May 24, 2025
Should You Follow Wedbushs Lead On Apple Stock Despite Price Target Cut
May 24, 2025 -
 Escape To The Country A Comprehensive Guide To Rural Relocation
May 24, 2025
Escape To The Country A Comprehensive Guide To Rural Relocation
May 24, 2025
Latest Posts
-
 Apple Stock And Tariffs Assessing The Risks To Buffetts Portfolio
May 24, 2025
Apple Stock And Tariffs Assessing The Risks To Buffetts Portfolio
May 24, 2025 -
 Analysts 254 Apple Stock Prediction Time To Buy
May 24, 2025
Analysts 254 Apple Stock Prediction Time To Buy
May 24, 2025 -
 Buffetts Apple Investment Navigating The Impact Of Trump Era Tariffs
May 24, 2025
Buffetts Apple Investment Navigating The Impact Of Trump Era Tariffs
May 24, 2025 -
 Apple Stock 200 Entry Point Before 254 Target
May 24, 2025
Apple Stock 200 Entry Point Before 254 Target
May 24, 2025 -
 Apple Vs Trump Tariffs Will Buffetts Top Tech Stock Crack
May 24, 2025
Apple Vs Trump Tariffs Will Buffetts Top Tech Stock Crack
May 24, 2025

